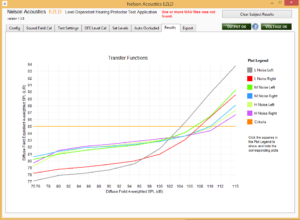
The results of each signal tested are plotted as a transfer function of the hearing protector with the criteria level shown as well. Each plot can be hidden by clicking the corresponding box in the key. The graph can be scaled by entering new minimum or maximum values on either axis.

