Overview
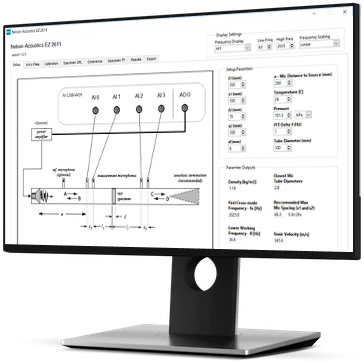
EZ2611 is an automated testing application designed to efficiently perform sound transmission tests on materials in an impedance (Kundt) tube to the ASTM E2611-09* standard.
Contact us for more details or to schedule an online demonstration.
*ASTM E2611-09: Standard Test Method for Measurement of Normal Incidence Sound Transmission of Acoustical Materials Based on the Transfer Matrix Method
Features
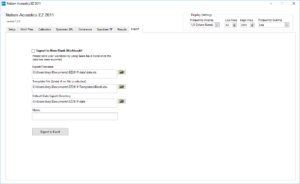
All data collected and generated by EZ2611 can be exported to Excel. Excel workbooks are automatically configured, labelled, and populated. Create a new workbook or use an existing template.
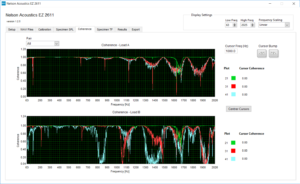
Data collected at each microphone position is compared to microphone one and coherence is displayed here. These plots can be viewed on at a time or all at once.
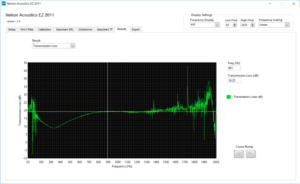
EZ2611 processes the data collected in many different ways. On the results tab you can view plots of:
- Absorption Coefficient
- Transmission Loss
- Reflection Coefficient
- Transmission Coefficient
- Characteristic Impedance
- Specific Impedance
- Wave Number
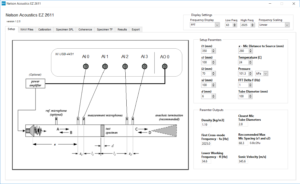
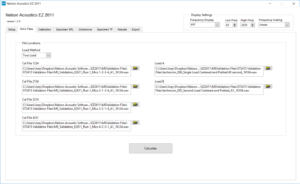
A standard test setup is displayed, conditions and parameters can be entered on this tab. Based on the general information entered here, and the files loaded on the WAV Files tab, all results are calculated for you.
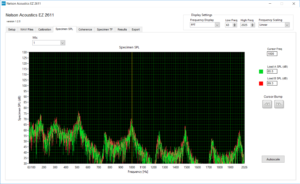
Here the sound pressure level (SPL) is shown in the frequency domain for each microphone. When using the two-load method, data from each load is shown together. The frequency range displayed is variable, and can show FFT, 1/3 octave band, or 1 octave band levels.
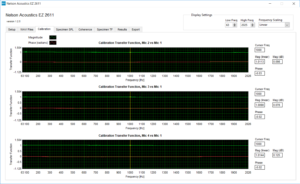
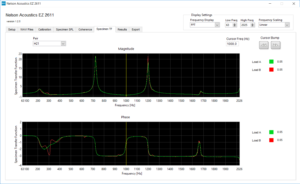
This tab displays the transfer functions relating all other microphones to the first. One plot shows the magnitude relation and the other shows phase relation. The data can be displayed as FFT, 1/3 octave, or 1 octave bands.

