This is a test

Sound Quality Analyzer conducts Modulation Analysis on audio WAV files Modulation (%) – The degree of modulation is determined in each of 47 overlapping critical bands. Apparent modulations due to broadband noise are identified by their band-to-band correlation and suppressed. An overall modulation value is obtained by weighting the band results according to empirically determined […]
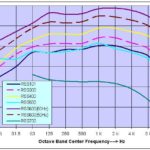
Follow this link to see specifications of individual Acculab reference sound sources. 2021 RSS Manual all models
All data collected and generated by EZ2611 can be exported to Excel. Excel workbooks are automatically configured, labelled, and populated. Create a new workbook or use an existing template.

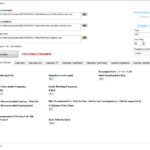
View plots of: Absorption Coefficient, Transmission Loss, Reflection Coefficient, Transmission Coefficient, Characteristic Impedance, Specific Impedance, Wave Number
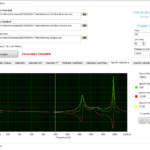
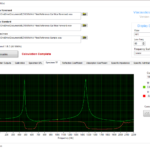
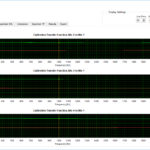
This tab displays the transfer functions relating all other microphones to the first. One plot shows the magnitude relation and the other shows phase relation. The data can be displayed as FFT, 1/3 octave, or 1 octave bands.
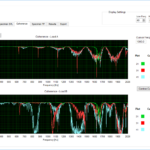
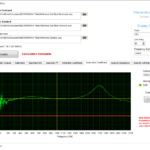
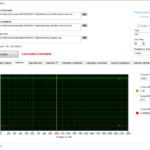
Data collected at each microphone position is compared to microphone one and coherence is displayed here. These plots can be viewed on at a time or all at once.
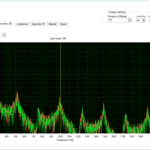
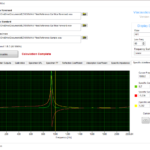
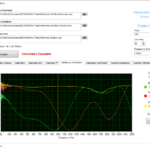
Back to the Calibration tab Here the sound pressure level (SPL) is shown in the frequency domain for each microphone. When using the two-load method, data from each load is shown together. The frequency range displayed is variable, and can show FFT, 1/3 octave band, or 1 octave band levels. Forward to the Coherence tab
Use this tab to verify that all microphones are calibrated to each other in magnitude and phase.
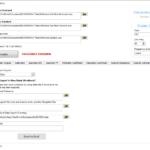
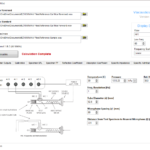
Load data collected (WAV files) and click “Calculate”. Analysis will be loaded the next tabs based on what is entered here and on the Setup tab.
A standard test setup is displayed, conditions and parameters can be entered on this tab. Based on the general information entered here, and the files loaded on the WAV Files tab, all results are calculated for you.

REATPro provides flexible configuration options to support a variety of data acquisition systems and audiometric testing protocols.
The Manual / Calibration tab can be used to present and calibrate any stimulus at any level to any or all outputs, continuously or pulsed. This can be useful for subject training, checking that the sound system is functioning and troubleshooting problems.

Retrieve prior thresholds from subject for comparison with current thresholds as required by ANSI S12.6.
Define test type: qualifying subject, training as subject, conducting protector test.
Subjects are tracked by subject ID for HIPA compliance.
Document what protector is being tested.
Load expected attenuation to speed up occluded threshold seeking.
Runs in automated manor from first to last frequency.
Runs both unoccluded and occluded modes.
Unoccluded mode has max level protections to ensure subject safety.
Provides level tracking and current threshold info with comparison to prior threshold.

Export to MSExcel based template files that users can customize to meet their own needs. Both Unoccluded and Occluded thresholds, as well as the sound pressure level vs time trace history to MSExcel for detailed analysis of threshold determination time and reversal history. A file header section provides documentation on all test setup parameters.

Allows comparison of subject threshold to qualifying average. Comparison of unoccluded thresholds within a session. Indicates compliance with ANSI S12.6 requirements.

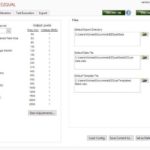
To configure the EZIL software for testing, simply choose the microphone input channels you wish to use to acquire data and the frequency range to be analyzed. An optional input channel for a reference microphone can also be selected, and reference attenuation levels can be entered manually or pasted from Excel.
Acquire and plot frequency dependent SPL data for the unoccluded ear via the Trident API with the click of a button.

Account for any additional noise that may otherwise skew results, acoustical and/or electrical. Trident acquires this baseline data and EZIL compensates for it when calculating final hearing protector attenuation data.
See a plot of left and right ear attenuation calculated in real-time based on unoccluded levels and background noise previously measured. Reference attenuation levels from previous tests and maximum possible attenuation can also be plotted here.

EZIL will generate a neatly organized Microsoft Excel file into which your data is exported. The user may also use their own Excel template.
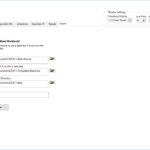
Select audio hardware devices and settings. Set global maximum values for peak voltage and SPL. Browse files and select WAV files to provide the desired test signals.
Calibrate the level of each noise source in the sound field at the reference position.

Set the parameters of how the test is performed based on the type of hearing protector. Configure criteria level, desired overshoot, timing and range of levels. Select directory and default files for exporting data.
Calculate the transfer function for the test subject’s ear relative to a reference microphone.

EZDamp provides test setup controls that allow you to configure the software to meet your specific testing needs, allowing it to work with the thermodynamic properties of your test setup and your National Instruments hardware. Configure Input and Output Hardware Settings Configure input transducer sensitivity Configure sampling settings Configure thermocouple settings EZDamp Test Setup allows […]
EZDamp provides both single test point manual mode operation and multiple test point automated execution modes. The automated mode provides instructions to the temperature chamber controller to go to the desired temperature, while monitoring a thermocouple to determine if the bar has reached temperature. Once the bar has reached the required temperature, within the configured […]
EZDamp provides an export routine that makes it easy to transfer the test results into pre-configured MSExcel template workbooks that provide additional data analysis after the test is complete. EZDamp is provided with several MSExcel analysis templates for post process of the EZDamp data. Templates for determinng the loss factor and Youngs modulus from the […]
EZQual setup allows you to configure the qualification measurement to meet the needs of your reverberation chamber and instrumentation system.
EZQual provides a manual operation mode that can be used to both calibrate your system and test signal levels prior to an automatic execution.
EZQual Automated Test Execution mode is designed to allow you to Start It, Walk Away and come back to get your data.
EZQual is designed to make it easy to export your test results into pre-configured Excel analysis templates that conduct the standard deviation and criteria comparison analysis.

Make measurements below threshold of hearing with these GRAS Low Noise Microphone Systems
The GRAS Sound and Vibration Model 26 CF preamplifier provides switchable high pass and A-weighted filtering. The integrated 20 Hz high pass filter helps eliminate inaudible low frequency signals from entering the data acquisition system and using up headroom. An integrated A-weighted filter removes energy as defined in by the A-weighting curve, allowing you to make A-weighted […]
